Plan View
Plan view can display one or several 2D geographical views by using the drag and drop function from the Variables panel to the Plan view.
|
|
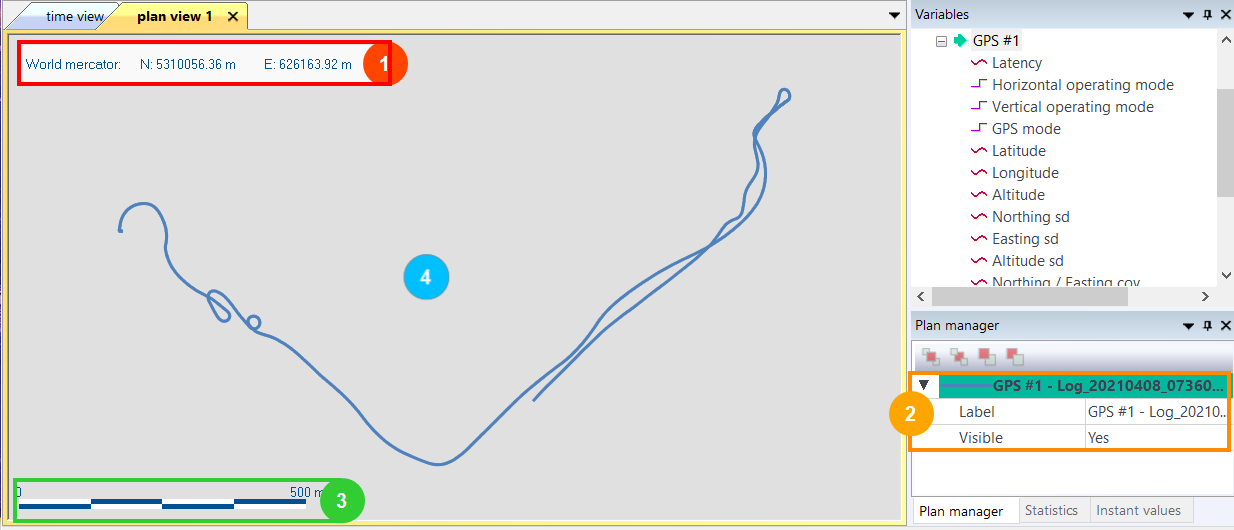
These are the coordinates of the data and the distance traveled displayed when the mouse moves on the 2D geographical view in the Plan view. Right-click on this view to get access to other options like to get projected position, to copy to clipboard, to adjust time scale, to use automatic UTM projection, to view distance traveled and to view time cursor position. Time cursor settings (color and width) are available in the Settings. For more details, refer to the Editing the Settings section. |
|
|
This is the name of the data displayed in the Plan manager panel. You can add several channels and then choose different means of display in the Plan manager window. Right-click on this panel to remove the data or to bring front/back or send front/back in case of several data. |
|
|
This is the scale of the 2D geographical view. |
|
|
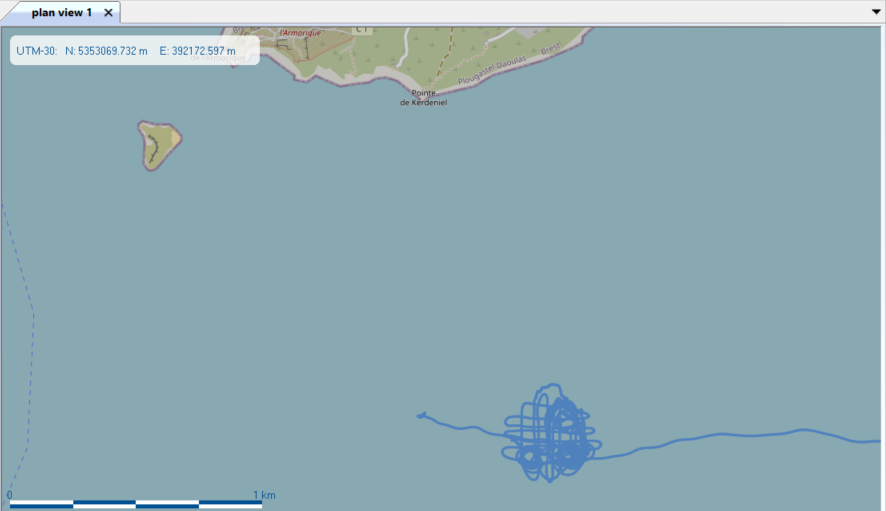
The trajectory of the channel is displayed in this part of the screen. You can display the trajectory either in normal mode or with the real map under the trajectory (OpenStreetMap option from Map layer). You can set the server of the map layer in the Settings window. Refer to the Editing the Settings section.
|


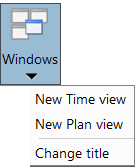
| 1. | To add a plan view window, select New Plan view in the Window tab. |
| 2. | Create a 2D geographical view by drag and dropping the channel(s) from the Variables panel into the Plan view - Display area. |
| 3. | To zoom in or out in the Plan view, use the mouse wheel. You can also use the buttons from the Home tab, Home Tab. |
| 4. | To remove the 2D view in the Plan view, right-click on the channel in the Plan manager then press the [del] key. |