Time View
In the Time view, all data is displayed in a graph form as below.
Time view can display one or several graphs forms by drag and dropping from the Variables panel to the Time view. It is always displayed on the Delph INS Subsea main window except when the project is closed.

|
|
This is the name of the graph form displayed in the Time view for the channel - data curve: GPS#1-Latency in this example. Right-click on this name to get access to other options like to remove the graph from, to copy graph or data to clipboard, to adjust time or vertical scale and to view accurately the data. |
|
|
This is the name of the data displayed in the Variables panel. Right-click on this panel to get access to the export options and to build a QA/QC report. |
|
|
This is the instant values of the data displayed in the Instant Values panel following the data in the graph form
|


| 1. | Create a graph displaying the variable(s) of your choice by drag and dropping the variable(s) from the Variables panel into the Display area. |
| 2. | To move quickly horizontally in the Time view, use the mouse wheel and the shift key of the keyboard. To move quickly vertically in the Time view, use the mouse wheel and the control key of the keyboard. You can also use the buttons from the Home tab, Home Tab. |
| 3. | To remove the graph in the Time view, click on the graph then press the [del] key. |
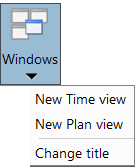
| 4. | To add another time view window, select New time view in the Window tab. |