Adding horizontal or vertical linemark to a graph
Horizontal and vertical linemarks can be added to a data file in the Time view in order to view precisely data on bottom or below this line.
The horizontal and vertical linemarks are automatically saved in the project.
|
1.
|
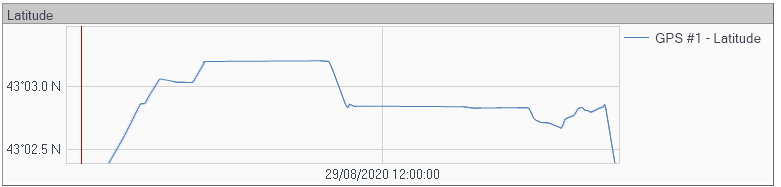
From your project, click one field of the channel from the Variables panel then move it to the Time view (like drag and drop function). |
|
2.
|
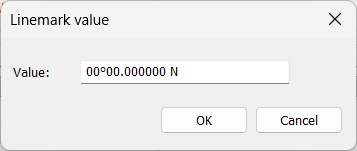
On the graph in the Time view, right-click and select Horizontal linemark to add a linemark following the Y axis of the graph. A marker value window is then displayed. |
|
3.
|
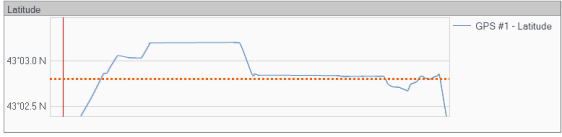
Enter the value then click on OK button. The Horizontal marker is displayed on the graph: |
|
4.
|
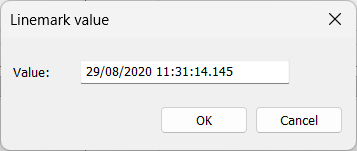
To add a vertical linemark, place the mouse cursor on the graph where to add the linemark. Then right-click and select Vertical linemark. A marker value window is displayed with the value where is the mouse cursor. |
|
5.
|
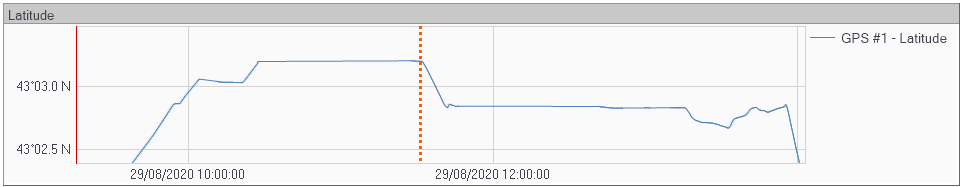
Enter the value then click on OK button. The vertical marker is displayed on the graph: |
|
6.
|
On the graph, you can also: |
|
>
|
Add horizontal and vertical linemarks on the same graph |
|
>
|
Remove the last horizontal or vertical linemark by selecting Remove last option. |
|
>
|
Clear all the horizontal or vertical linemarks by selecting Clear all option |
