Computing Statistics
|

|
Click on the picture to view the procedure:
|
|
|
Statistics can be computed from a data set over a certain time interval.
|
2.
|
Click one field of the channel then move it to the Time view (like drag and drop function). |
|
3.
|
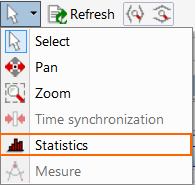
Click on the white arrow in the Graphics icons then select Statistics option. |
|
4.
|
Click on the graph and drag the cursor over the interval of time to be computed in the graph: |
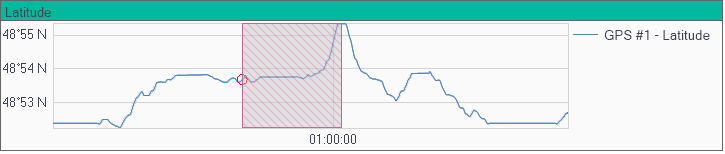
The time interval on the graph is displayed by a red cover.
|
5.
|
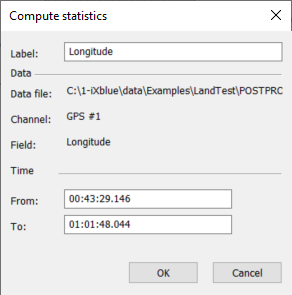
Release the mouse button, the Compute Statistics pop-up is displayed: |
|
6.
|
Edit the Label and the time interval: From and To. Then click OK to validate. |
|
7.
|
The statistics for the time interval are displayed in the Statistics Panel: |
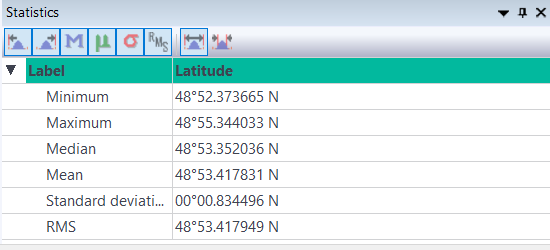
More statistic values are available:
|
>
|
click  to display minimum values to display minimum values |
|
>
|
click  to display maximum values to display maximum values |
|
>
|
click  to display median values to display median values |
|
>
|
click  to display mean values to display mean values |
|
>
|
click  to display standard deviation values to display standard deviation values |
|
>
|
click  to display RMS values to display RMS values |
|
>
|
click  to display full data set to display full data set |
|
>
|
click  to display restricted data set to display restricted data set |
|
8.
|
Right click  to display all the statistics values computed on the full data set. to display all the statistics values computed on the full data set. |
|
9.
|
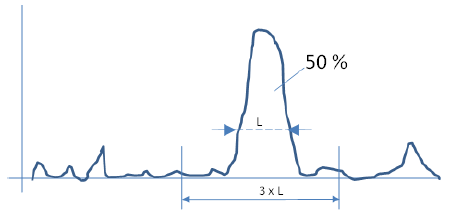
Click  to display the statistics values computed on the restricted data set (50% x 3).. This means statistics on the interval shown on the picture below: to display the statistics values computed on the restricted data set (50% x 3).. This means statistics on the interval shown on the picture below: |
|
10.
|
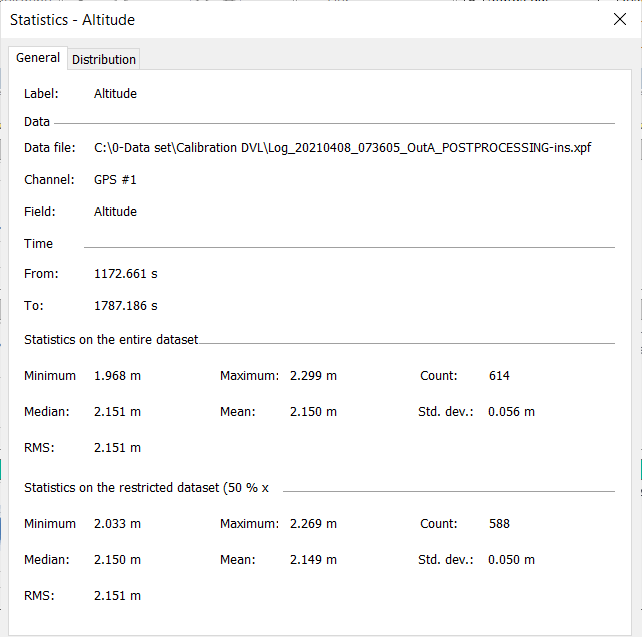
Right-click on Statistics panel then select Properties to get more information. |
The following window is displayed with 2 tabs delivering numerical (General tab) and graphical (Distribution tab) statistical data: