Configuring the design of the data
|
|
Click on the picture to view the procedure |
|
|

Colors and lines of data can be modified on the Time view and on the Plan view.
Time View
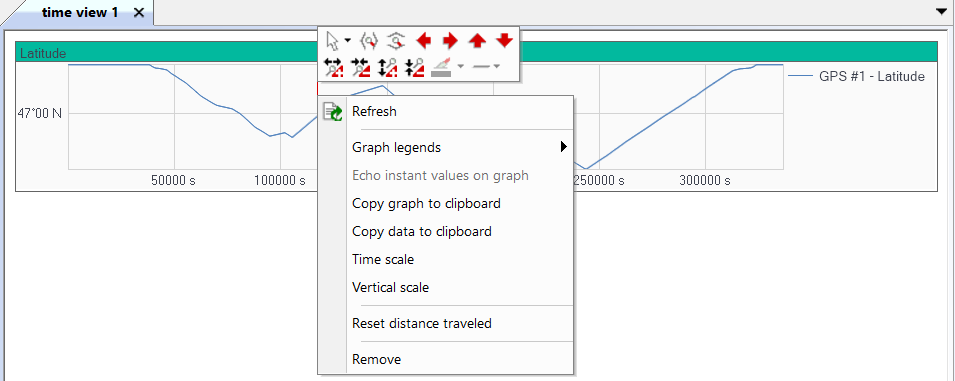
| 1. | In the Time View, right click on the data name then the following pop-up menu is displayed: |
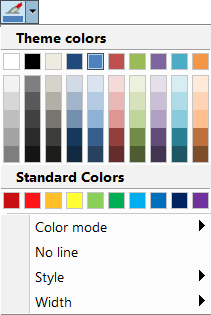
| 2. | Click  icon to modify the template of the line by selecting the color, the style and the width of the line with these options: icon to modify the template of the line by selecting the color, the style and the width of the line with these options: |
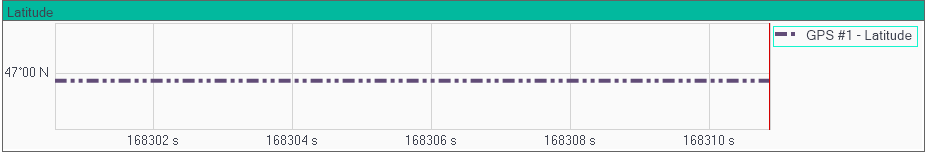
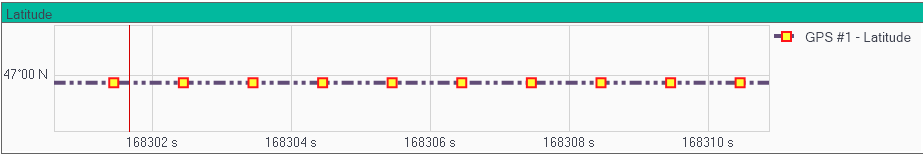
For example, the line below is "purple" color, "Dash dot dot" style and with "4 pt" of width.
| 3. | Click  icon to modify the template of the marker in order to select the type of point, the style of marker , the color of the external point line and the filled color of the point. Then the following pop-up window is displayed: icon to modify the template of the marker in order to select the type of point, the style of marker , the color of the external point line and the filled color of the point. Then the following pop-up window is displayed: |
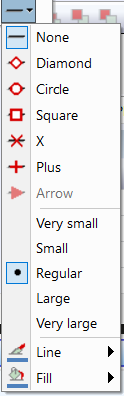
For example, the markers below are "Square", "Regular", "red "line and "yellow" as filled color:
Plan view
| 1. | For the data set in the Plan view, in the Plan manager right-click on the channel to get the display options: theme colors or line/point display options: |
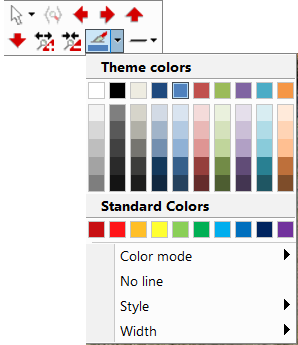
| 2. | Click icon to modify the template of the line by selecting the color, the style and the width of the line. |
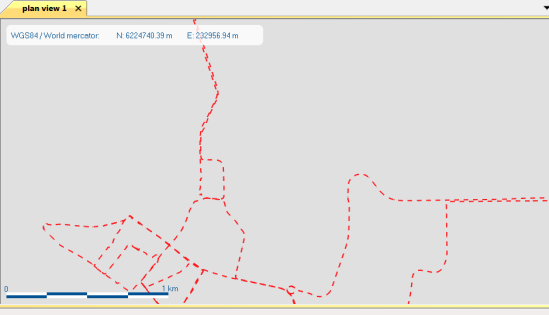
For example, the line below is red color, dash style and with 3 pt of width.
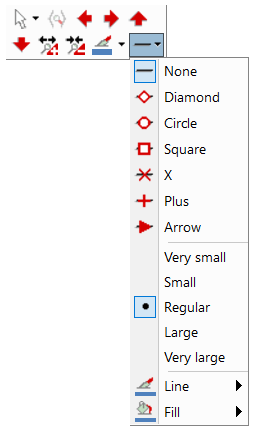
| 3. | Click icon to modify the template of the marker then the following pop-up window is displayed: |
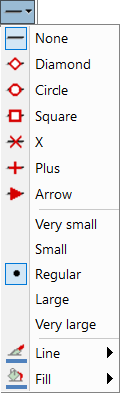
| 4. | Select the type of point, the style of marker, the color of the external point line and the filled color of the point. |
For example, the markers below are arrow large design, black line and blue as filled color:
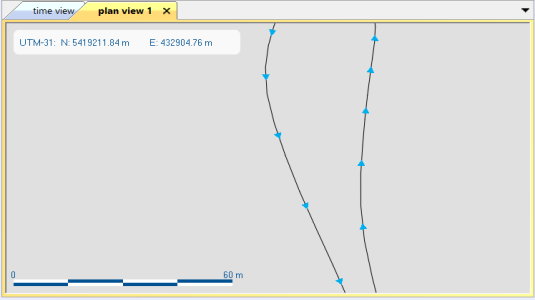
The arrow mark allows the user to view the direction of the trajectory.