Displaying the trajectory following the Standard Deviation threshold
|
|
Click on the picture to view the procedure |
|
|

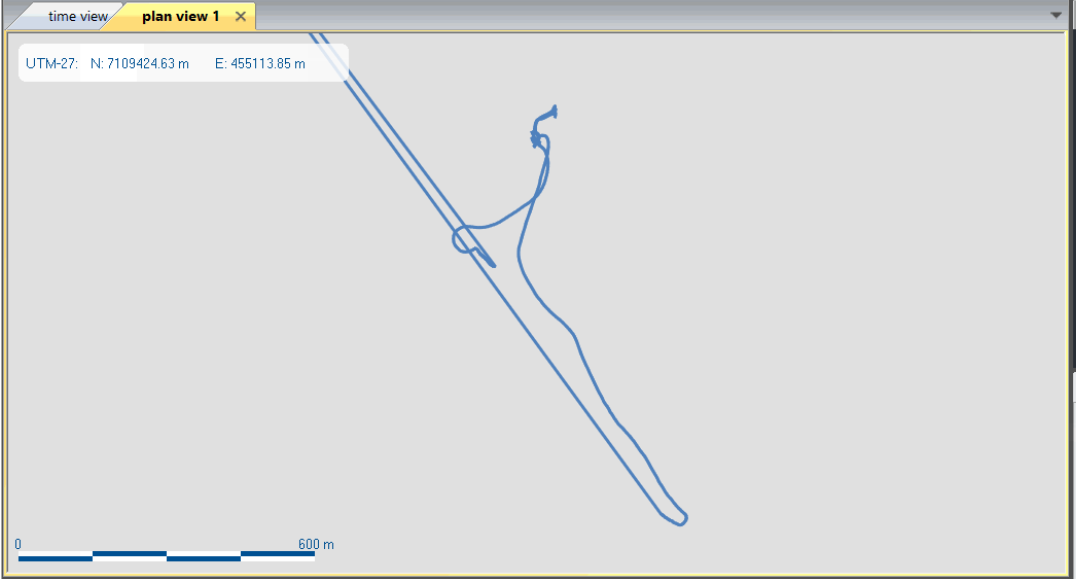
| 1. | When inserting a Plan view, the plan manager is displayed below the Variables panel. Drag and drop the channel from the Variables panel to the Plan view window. The following trajectory is displayed: |
| 2. | You can display the variation of the position standard deviation with colors by right clicking on Color mode then select Position SD. A new window is displayed in order to enter the values for the low value and the high value of the position standard deviation thresholds. |
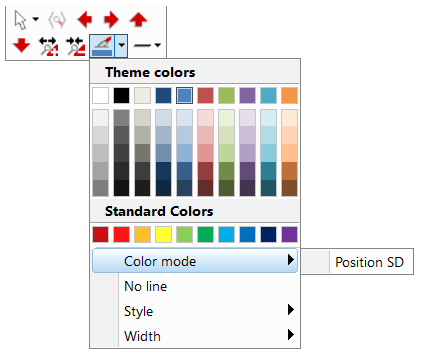
| 3. | By clicking on the Position SD option in Color mode of the xpf file in the Plan manager, the following window is displayed to enter the low and high standard deviation values: |
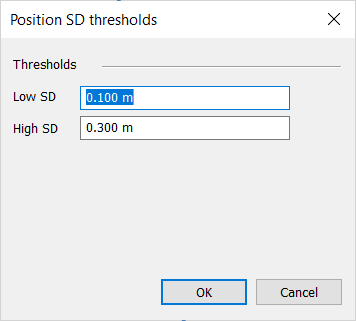
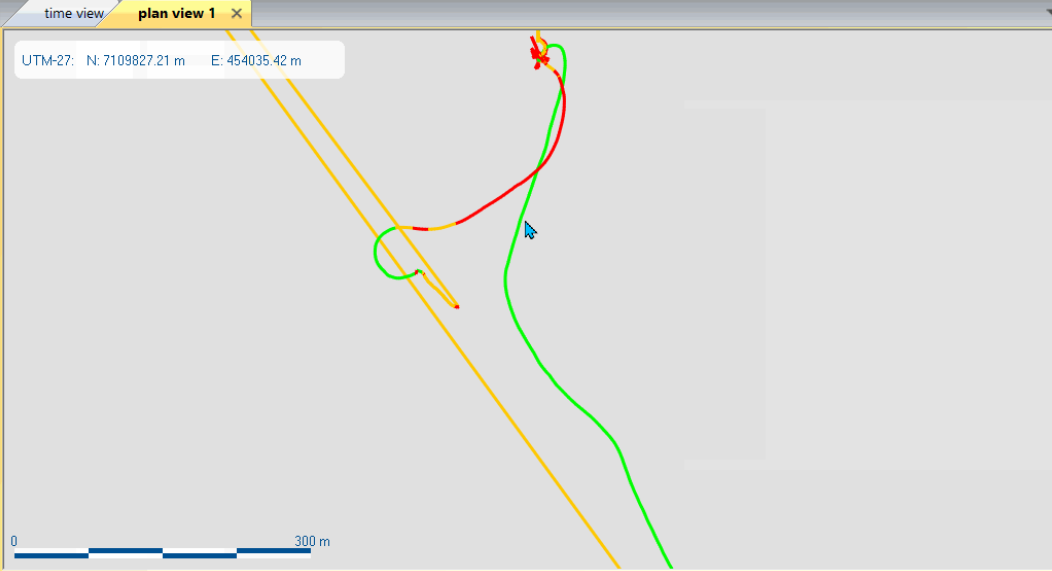
| 4. | Click on the OK button. The trajectory is displayed in several colors: |
| > | Green if the value is inferior to the low threshold value |
| > | Orange if the value is between the low threshold value and the high threshold value |
| > | Red if the value is superior to the high threshold value |
Note: this feature is available only with standard deviation data in the channel.
Example: