Displaying the data in a graph form
|
|
Click on the picture to view the procedure |
|
|

Data can be displayed in a graph form by using the drag and drop function from the Variables panel to the Time view of Delph INS Subsea.
Multiple data sharing the same units may be displayed in the same graph or split into several graphs.
| 1. | Add data file to the project, refer to Adding Data File. |
| 2. | In the Variables panel, double-click on a channel to expand it. The fields of this channel are then displayed; |
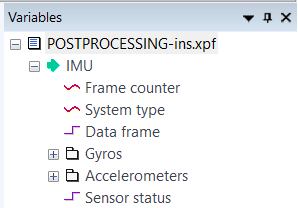
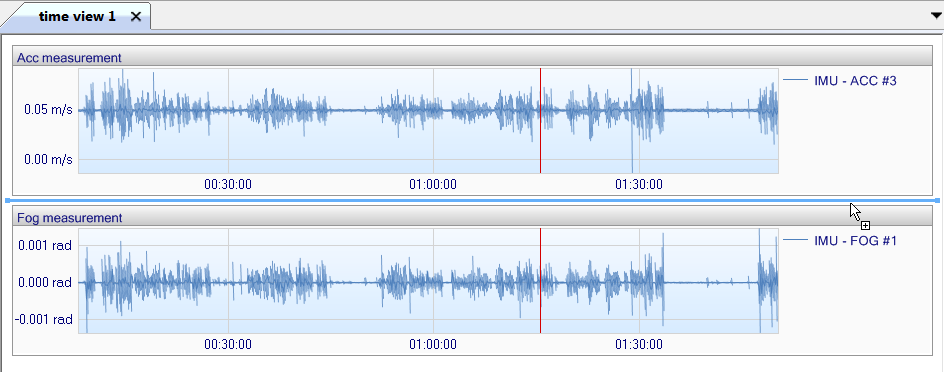
| 3. | Click one field of the expanded channel then move it to the Time view (like drag and drop function). The data is then displayed in the Time view: |
If needed, click on  Refresh button to get all the data.
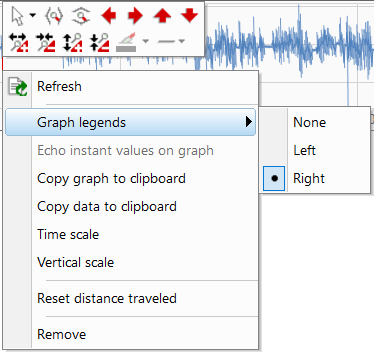
| 4. | Right click on the graph to display the pop-up menu and select in the Graph Legends if you want the legend on the left or the right of the graph or no legend at all.: |
| 5. | To add more field into the Time View, drag and drop a field into the Time View. The graph could be displayed where you want, before or after an existing graph. The graph is always displayed under the blue line, it indicates the location where the graph can be displayed: |
| 6. | If needed, you can add more Time view by clicking on Windows menu then select the New Time view option: |
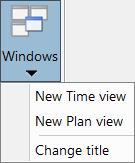
Select the Change title option to modify the title of the selected time view.
| 7. | It is possible to overlay several fields in the same graph: select another field and drag and drop it on the already displayed data. The two fields are overlaid: |
To remove a graph, right click on the field name and select Remove.
| 8. | To display range meter data following the number of beacon, you can select the name of the beacons by clicking on the Beacon ID name: |
![]()
Then select the beacon ID you want to display on this view.