Looking at the instant values
|
|
Click on the picture to view the procedure |
|
|

Three means to look at precisely the instant values:
| > | with the variables and instant values panels |
| > | with the Time view and instant values panel |
| > | with the Time view, Plan view and instant values panels |
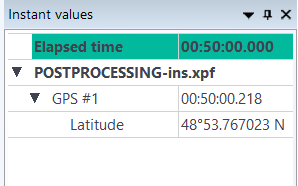
Look at the values following the time
| 1. | Open a project or create a new project (refer to How to create a new project). |
| 2. | Click on the Instant value panel option from the View group of the Home menu. |

| 3. | Drag and drop a variable from the Variables panel to the Instant values panel: |
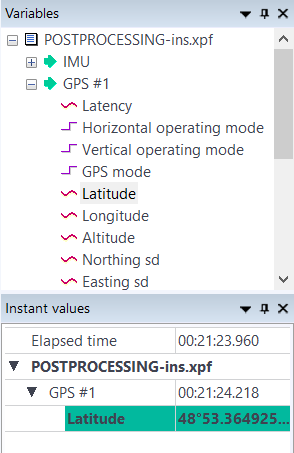
| 4. | Modify the time value (00:00:00 format) then the latitude value corresponding to this time value is then displayed. |
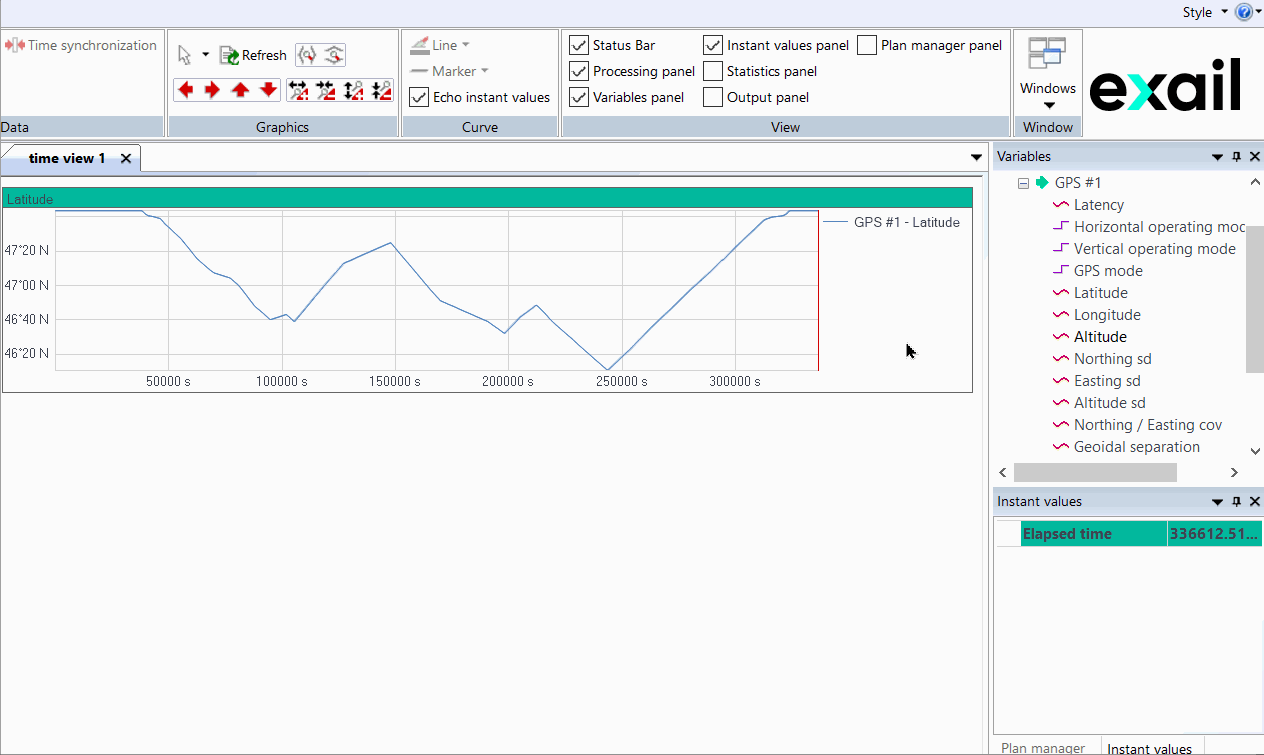
Look at the values with the Time view and Instant Values panel
| 1. | Open a project or create a new project (refer to How to create a new project). |
| 2. | Check that Instant values panel is displayed on the main menu: |
| 3. | Drag and drop a variable from the Variables panel to the Time view. Then drag and drop the variable to the Instant values panel: |
| 4. | Move the mouse on the graph: the latitude value is displayed according the mouse position. |
| 5. | Check  : a red circle is displayed on the curve to highlight values corresponding to the value displayed in the Instant values panel. : a red circle is displayed on the curve to highlight values corresponding to the value displayed in the Instant values panel. |
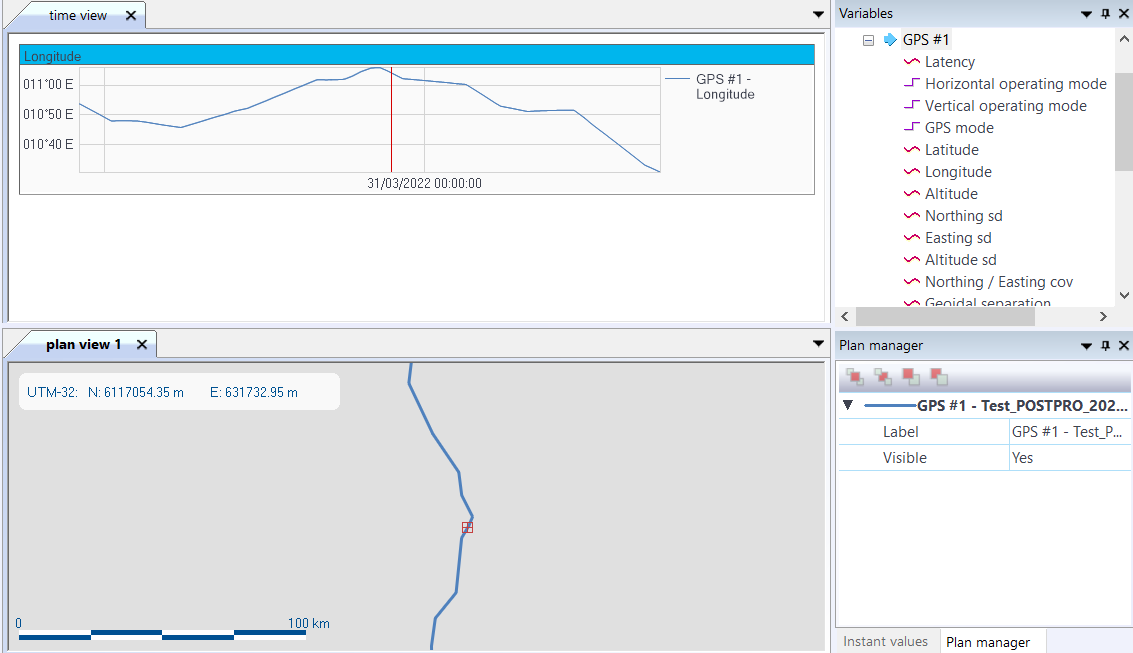
Look at the values with the Time view, Plan view and Instant Values panel
| 1. | Open a project or create a new project (refer to How to create a new project). |
| 2. | Check that Instant values panel is displayed on the main menu: |
| 3. | Drag and drop a variable from the Variables panel to the Time view. Then drag and drop the variable to the Instant values panel, see previous page. |
| 4. | Add a New Plan view then drag and drop the data set to be displayed: |

| 5. | Move the Plan view below the Time view: |
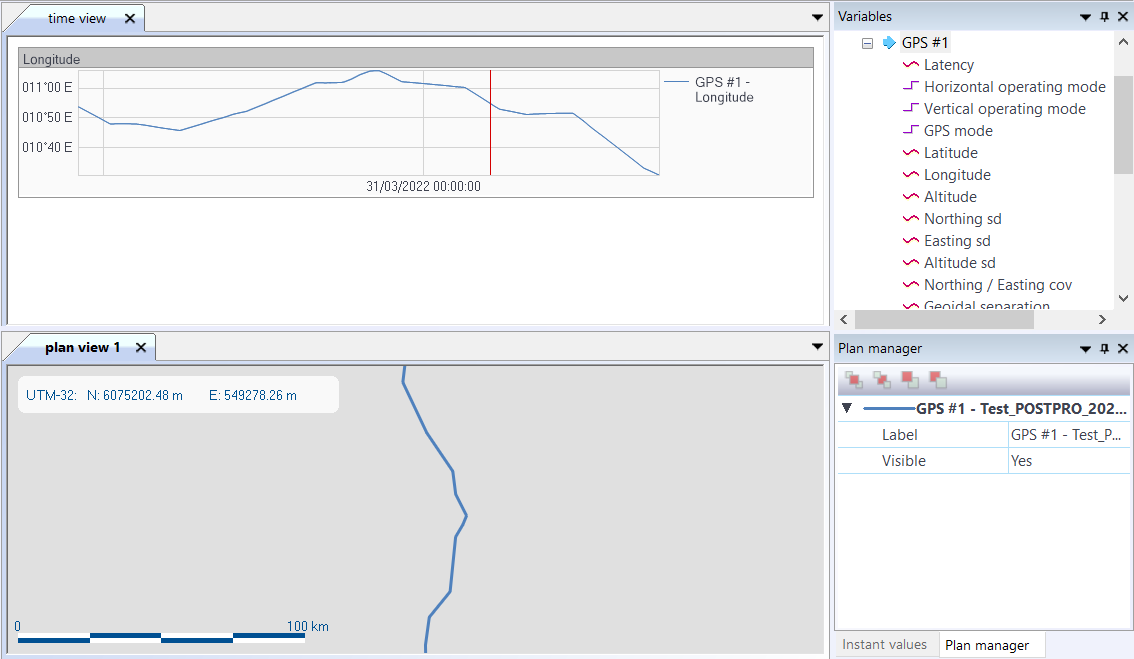
| 6. | Move the mouse on the Time view, the corresponding position is displayed in the Plan view with a red square. |
| 7. | To know the position on the Plan view, right click and select Time cursor position. |
Move the mouse or click on the point located on the trajectory, the traveled distance is then displayed on the Plan view with the distance from the zero point.
The position is then displayed at the left following the position of the red square: