Viewing data on a specific time or vertical scale
Time or vertical scale allows you to zoom on a specific scale in the Time view.
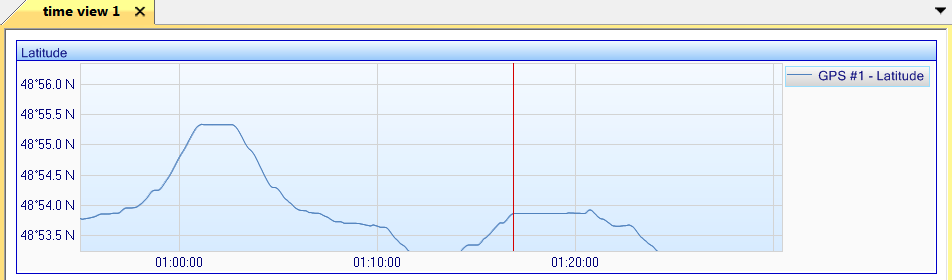
| 1. | Add data in a Time view (refer to Displaying the data in a graph form), for example: |
| 2. | Right click on the graph then select Time scale, the following pop-up is displayed: |
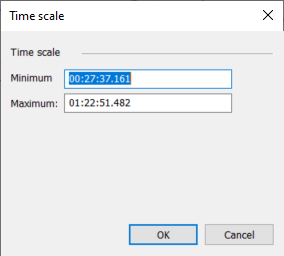
| 3. | Enter the minimum and maximum values of the Time scale in order to display the data in this interval. |
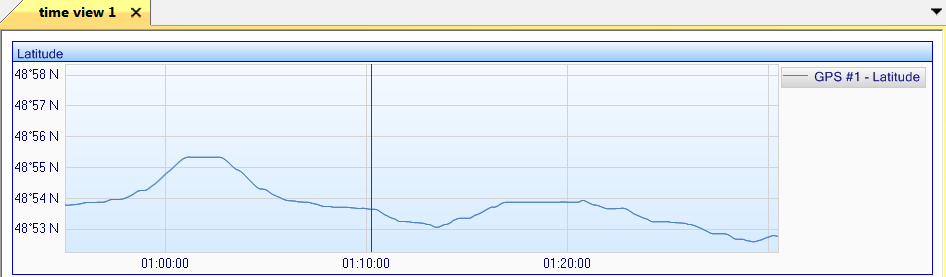
| 4. | Click OK. The data are then displayed following the new time scale. |
| 5. | Right click on the graph then select Vertical scale, the following pop-up is displayed: |
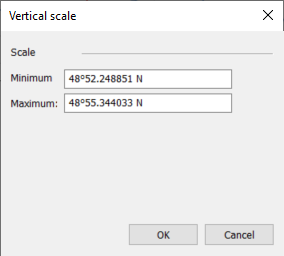
| 6. | Enter the minimum and maximum values of the Vertical scale in order to display the data in this interval. |
| 7. | Click OK. The data are then displayed following the new vertical scale. |