Viewing precisely the 2D view in the Plan view
Delph INS Subsea gives some tools in order to view precisely the data.
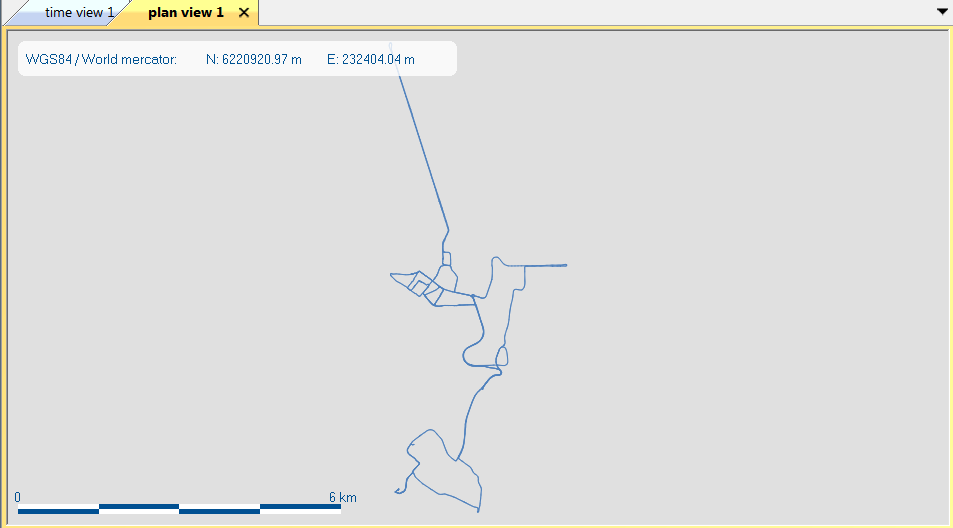
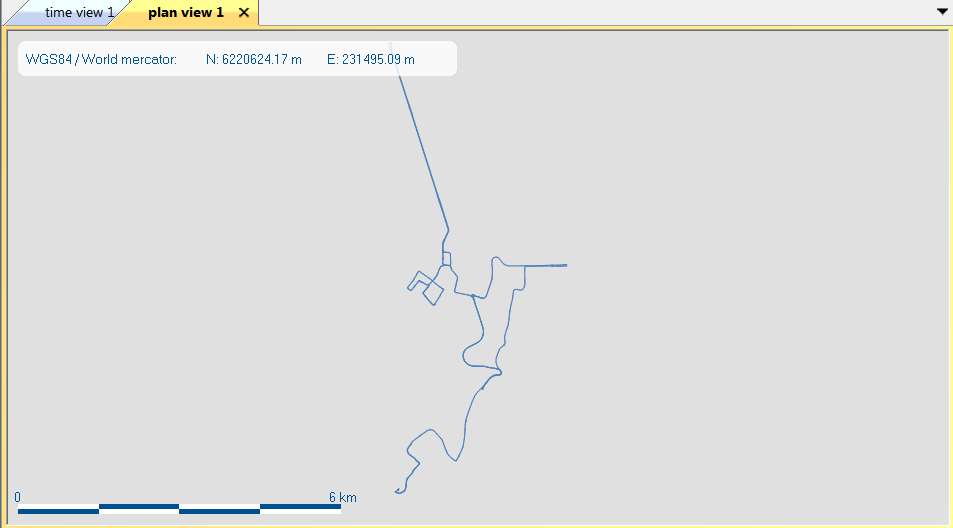
| 1. | Add data in a Plan view (refer to Displaying the data set in 2D geographical view), for example: |
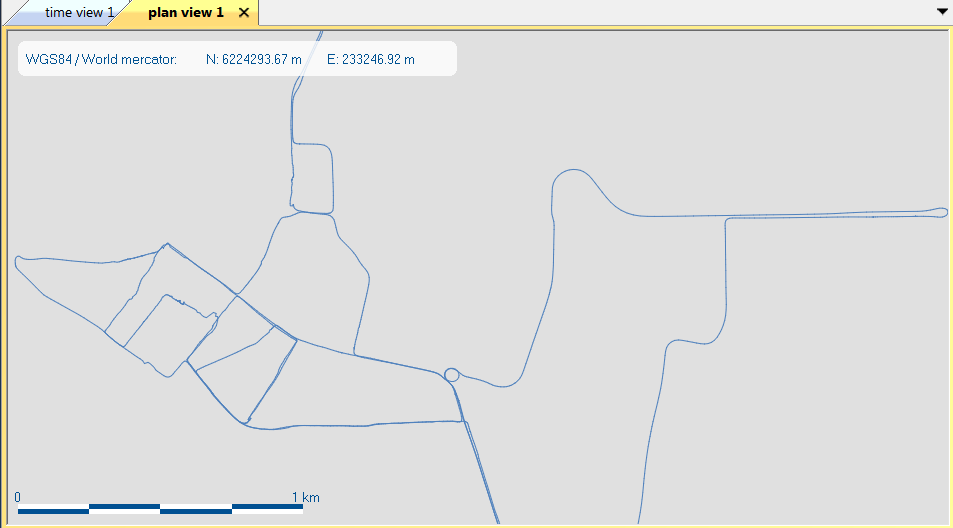
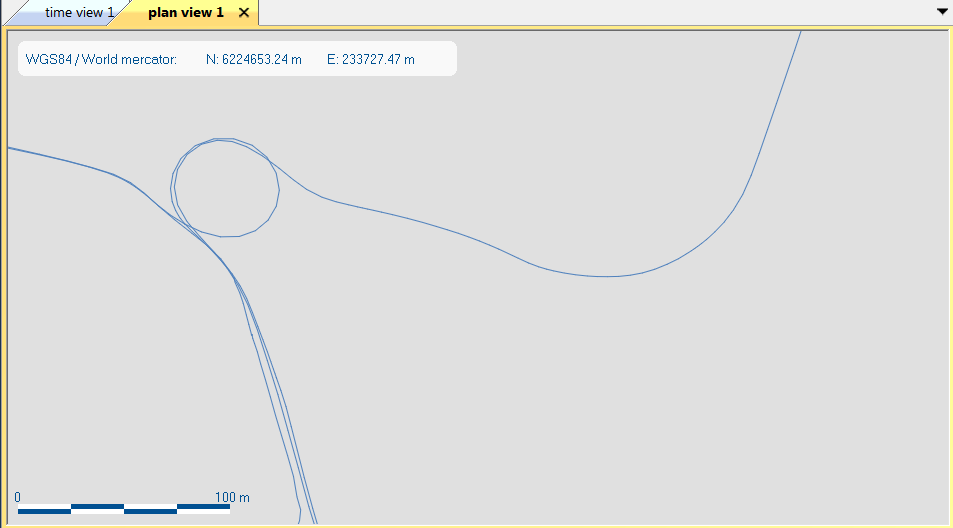
| 2. | To zoom quickly, use the mouse wheel or use the [+] key to zoom in or [-] key to zoom out. To move the graph, left click then move the mouse in order to move the graph then release the left button of the mouse. |
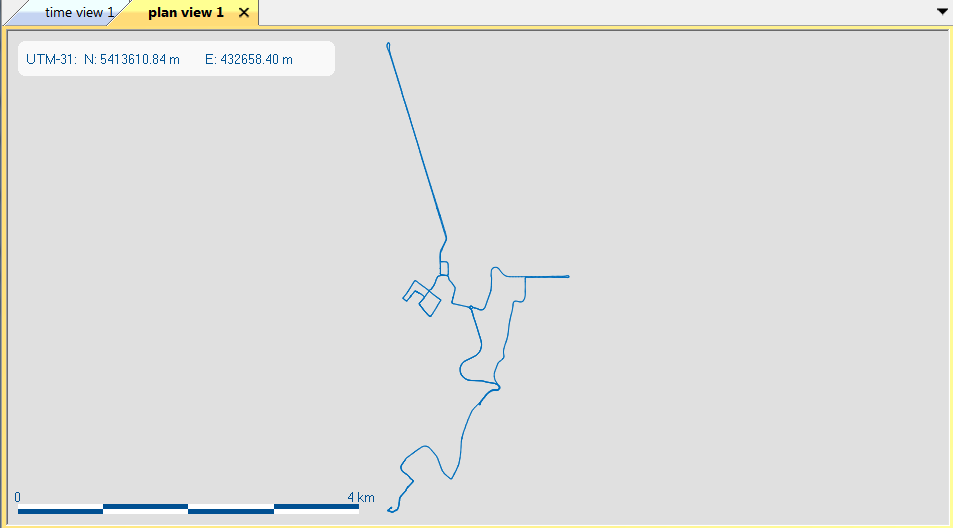
| 3. | Right click and select Use automatic UTM projection to compute the data UTM zone and display the data in this UTM projection. By default the Mercator projection is applied, you may change the default projection from the Spatial Reference box, refer to Selecting the spatial reference. |
| 4. | Right click then select Time scale to zoom on a specific time scale. The following pop-up is then displayed: |
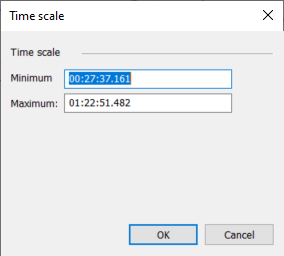
Enter a minimum value and a maximum value.
Click OK, the graph is then displayed into these values:
| 5. | Right click then select View all to view all the graph: |