Viewing precisely the graph with the Time view
Delph INS Subsea gives some tools in order to view the data precisely .
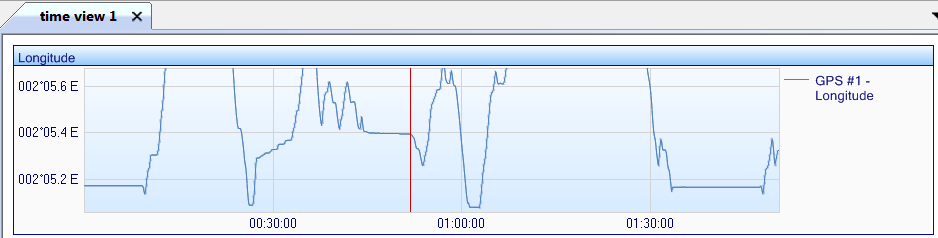
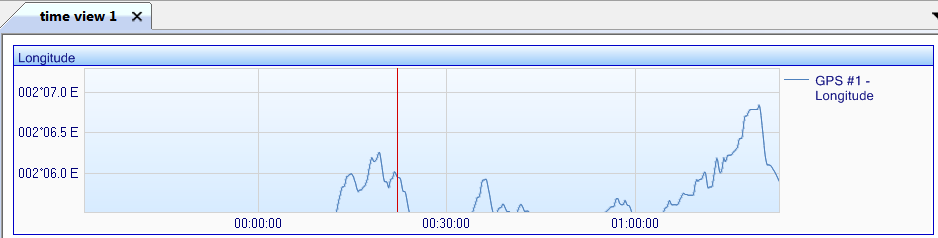
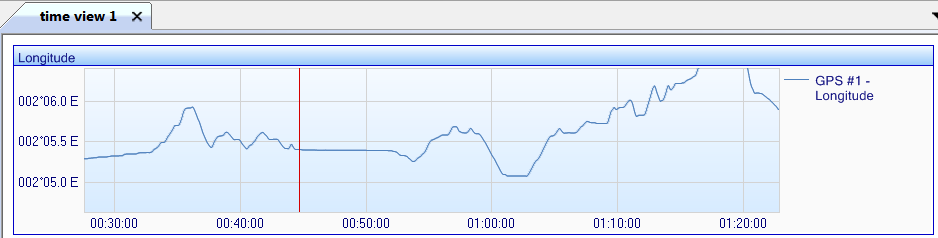
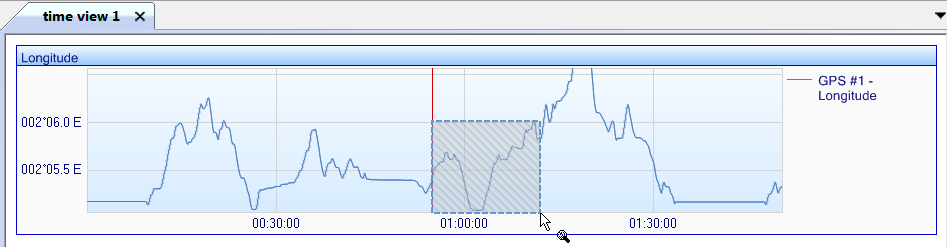
| 1. | Add data in a Time view (refer to Displaying the data in a graph form), for example: |
| 2. | On the main ribbon, several graphic icons allow you to get access to the information: |
Note: to zoom, you can use the mouse:
| > | To move in horizontal: use the mouse wheel and the shift key of the keyboard. |
| > | To move in vertical: use the mouse wheel and the control key of the keyboard. |
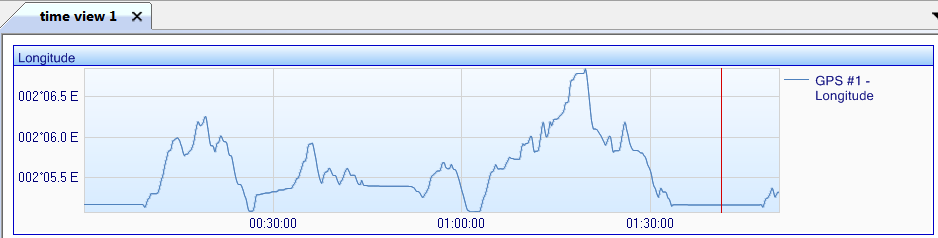
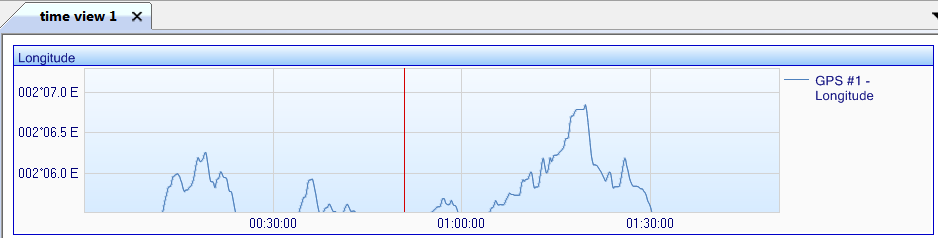
| 3. | Click
 to scroll the horizontal scale to the left. to scroll the horizontal scale to the left. |
| 4. | Click
 to scroll the horizontal scale up. to scroll the horizontal scale up. |
| 5. | Click
 to scroll the horizontal scale to the right. to scroll the horizontal scale to the right. |
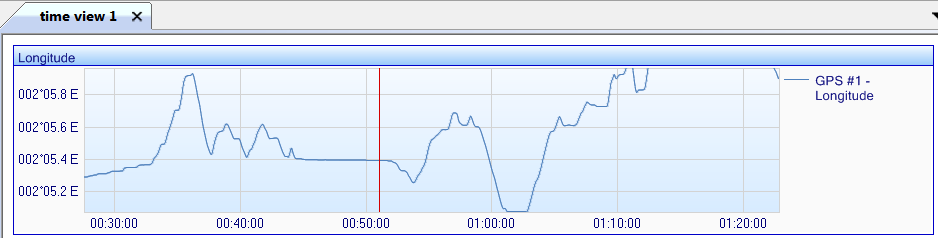
| 6. | Click  to display all the data in the vertical plan. to display all the data in the vertical plan. |
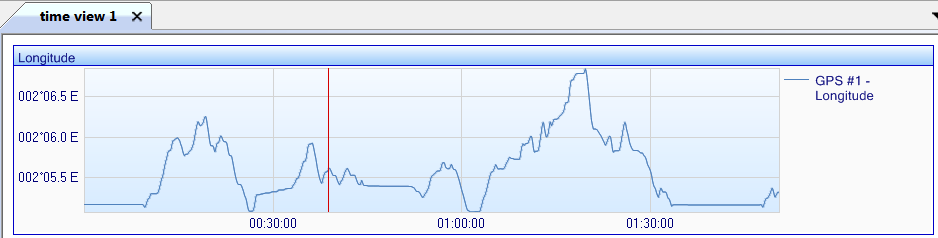
| 7. | Click
 to increase the horizontal factor. to increase the horizontal factor. |
| 8. | Click
 to scroll the horizontal scale down. to scroll the horizontal scale down. |
| 9. | Click
 to increase the vertical factor. to increase the vertical factor. |
| 10. | Click to decrease the horizontal factor. to decrease the horizontal factor. |
| 11. | Click
 to decrease the vertical factor. to decrease the vertical factor. |
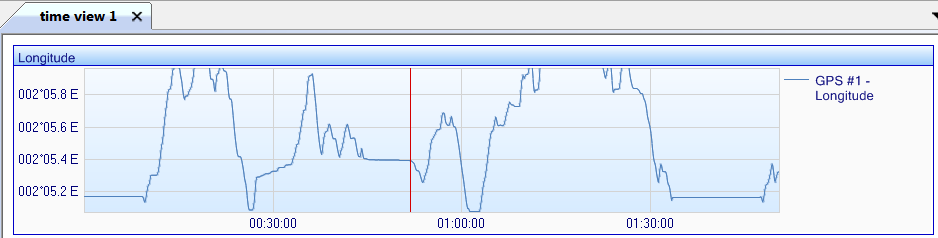
| 12. | Click
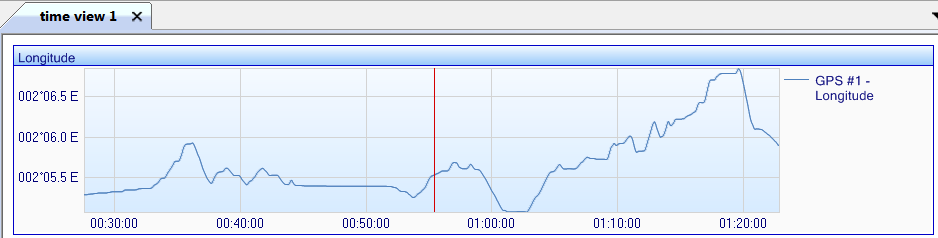
 then select then select  to draw a rectangle in order to zoom the data in this rectangle. to draw a rectangle in order to zoom the data in this rectangle. |
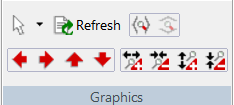
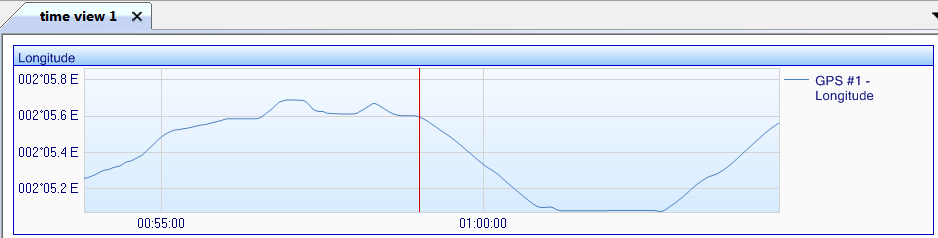
The data is then displayed:
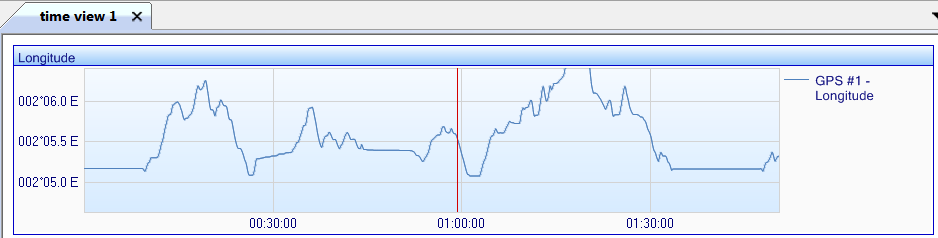
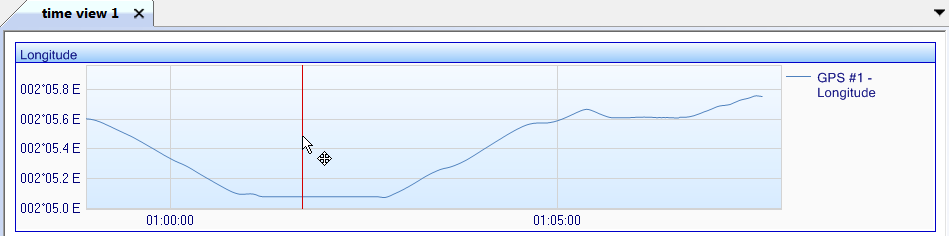
| 13. | Click then select  to move the graph in the Time view. to move the graph in the Time view. |
| 14. | Click  to display all the data in the horizontal plan. to display all the data in the horizontal plan. |