Displaying the LBL sensor data set in 2D geographical view
Range meter (LBL) set can be displayed in 2D geographical view by using the drag and drop function from the Variables panel to the Plan view of Delph INS Subsea.
| 1. | Add data file to the project, refer to How to add data file?. |
| 2. | Add a Plan view by clicking on Windows menu then select the New Plan view option: |
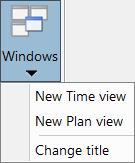
Select the Change title option to modify the title of the selected plan view.
| 3. | Click on range meter / LBL data set then move it to the Plan view (like drag and drop function). The beacons are then displayed in the Plan view with the name of each beacon and the data set is displayed in the Plan manager panel. |
![]()