Displaying the LBL sensor data set in a graph form
Range meter (LBL) data can be displayed in a graph form by using the drag and drop function from the Variables panel to the Time view of Delph INS Subsea.
Multiple data sharing the same units may be displayed in the same graph or split into several graphs.
| 1. | Add data file to the project, refer to How to add data file?. |
| 2. | In the Variables panel, double-click on a channel to expand it. The fields of this channel are then displayed; |
![]()
| 3. | Click on the Residual field of the expanded channel then move it to the Time view (like drag and drop function). Do the same for the Normalized residual (residuals divided by the standard deviation of the measure). The data are then displayed in the Time view. |
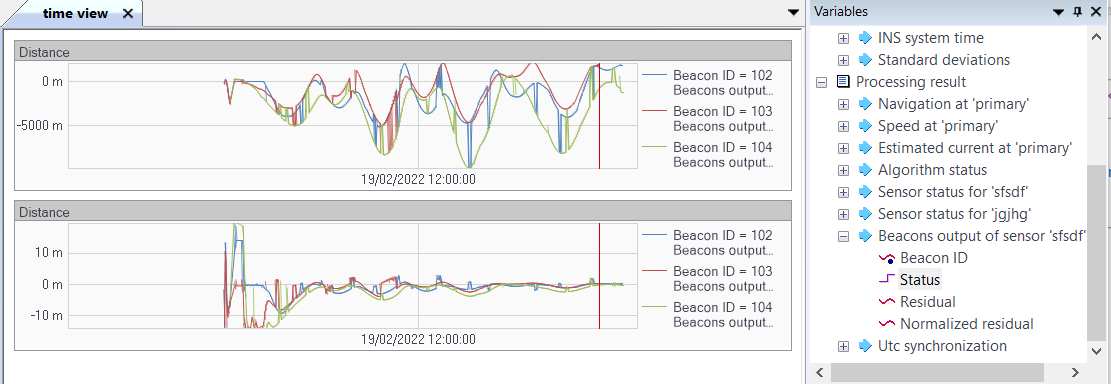
| 4. | Click on the Status field of the expanded channel then move it to the Time view (like drag and drop function). Do the same for the other beacons if needed in order to display the status of each beacon. Then change the beacon name for the two last graphs by clicking on the beacon name. |
![]()